
> FINANCES

Financial Transparency

The Texas Comptroller of Public Accounts has developed standards for local governments to provide online financial transparency. This section summarizes the most requested financial information about North Central Texas College.
For more information, visit Texas Comptroller Financial Transparency.
Investments
North Central Texas Community College District (NCTC):
Does not employ outside investment advisers or managers.
Does not use soft dollar, directed brokerage, or directed commission, commission recapture, or similar arrangements.
NCTC is associated with the North Central Texas College Foundation. The market value of the foundation’s investments at August 31, 2023 was $13,691,420.
Contact Information for the Foundation:
Debbie Sharp
1525 W California Street
Gainesville, TX 76240
(940) 668-3305
Investment Policies
NCTC Investment Reports
Fiscal Year 2023-2024
Other Financial Information
Traditional Finances Summary For 2022
Traditional Finance Summary for the most recent fiscal year that ended on 8/31/2022.
Total Expenditures — $68,538,261 (Per Student* $5,409)
Total Revenues — $769,640,651 (Per Student $5,496)
Total Revenues from Property Taxes — $4,500,945 (Per Student $355)
Full Time Equivalency (All Personnel) — 522
Full Time Equivalency (Students**) — 4,025
*Per Student calculations based on 11,333 unduplicated students for 2021-2022 credit enrollment.
**FTE Students is based on Fall 2021 credit enrollment.
Historical Tax Rates per $100 Valuation
Maintenance/Operations
2019 = 0.0808
2020 = 0.0757
2021 = 0.0728
2022 = 0.0731
2023 = 0.0642
Interest/Sinking (Debt)
2019 = 0.0294
2020 = 0.0256
2021 = 0.0250
2022 = 0.0218
2023 = 0.0209
Combined Tax Rate
2019 = 0.1102
2020 = 0.1013
2021 = 0.0978
2022 = 0.0949
2023 = 0.0851
5-Year Trend of Revenues/Expenditures Per Student

Revenues Per Student*
2017-2018 — $3,418
2018-2019 — $3,399
2019-2020 — $4,463
2020-2021 — $5,913
2021-2022 — $6,145
Expenditures Per Student*
2017-2018 — $3,383
2018-2019 — $3,727
2019-2020 — $4,508
2020-2021 — $4,901
2021-2022 — $6,048
Total Revenues
2017-2018 — $55,363,627
2018-2019 — $55,463,729
2019-2020 — $64,026,649
2020-2021 — $74,922,161
2021-2022 — $69,640,651
Total Operating Expenses
2017-2018 — $54,795,727
2018-2019 — $60,830,410
2019-2020 — $64,675,228
2020-2021 — $62,099,353
2021-2022 — $68,538,261
*Unduplicated, 12 mos, students
2017-2018 — 16,196
2018-2019 — 16,320
2019-2020 — 14,346
2020-2021 — 12,671
2021-2022 — 11,333
5-Year Trend of Tax Rates per $100 Valuation

Maintenance/Operations
2018-2019 — 8.08
2019-2020 — 7.57
2020-2021 — 7.28
2021-2022 — 7.31
2022-2023 — 6.42
Interest/Sinking (Debt)
2018-2019 — 2.94
2019-2020 — 2.56
2020-2021 — 2.50
2021-2022 — 2.18
2022-2023 — 2.09
Combined Tax Rate
2018-2019 — 11.02
2019-2020 — 10.13
2020-2021 — 9.78
2021-2022 — 9.49
2022-2023 — 8.51
Comparison of Source of Funds 2020-2021 to 2021-2022 (in dollars)
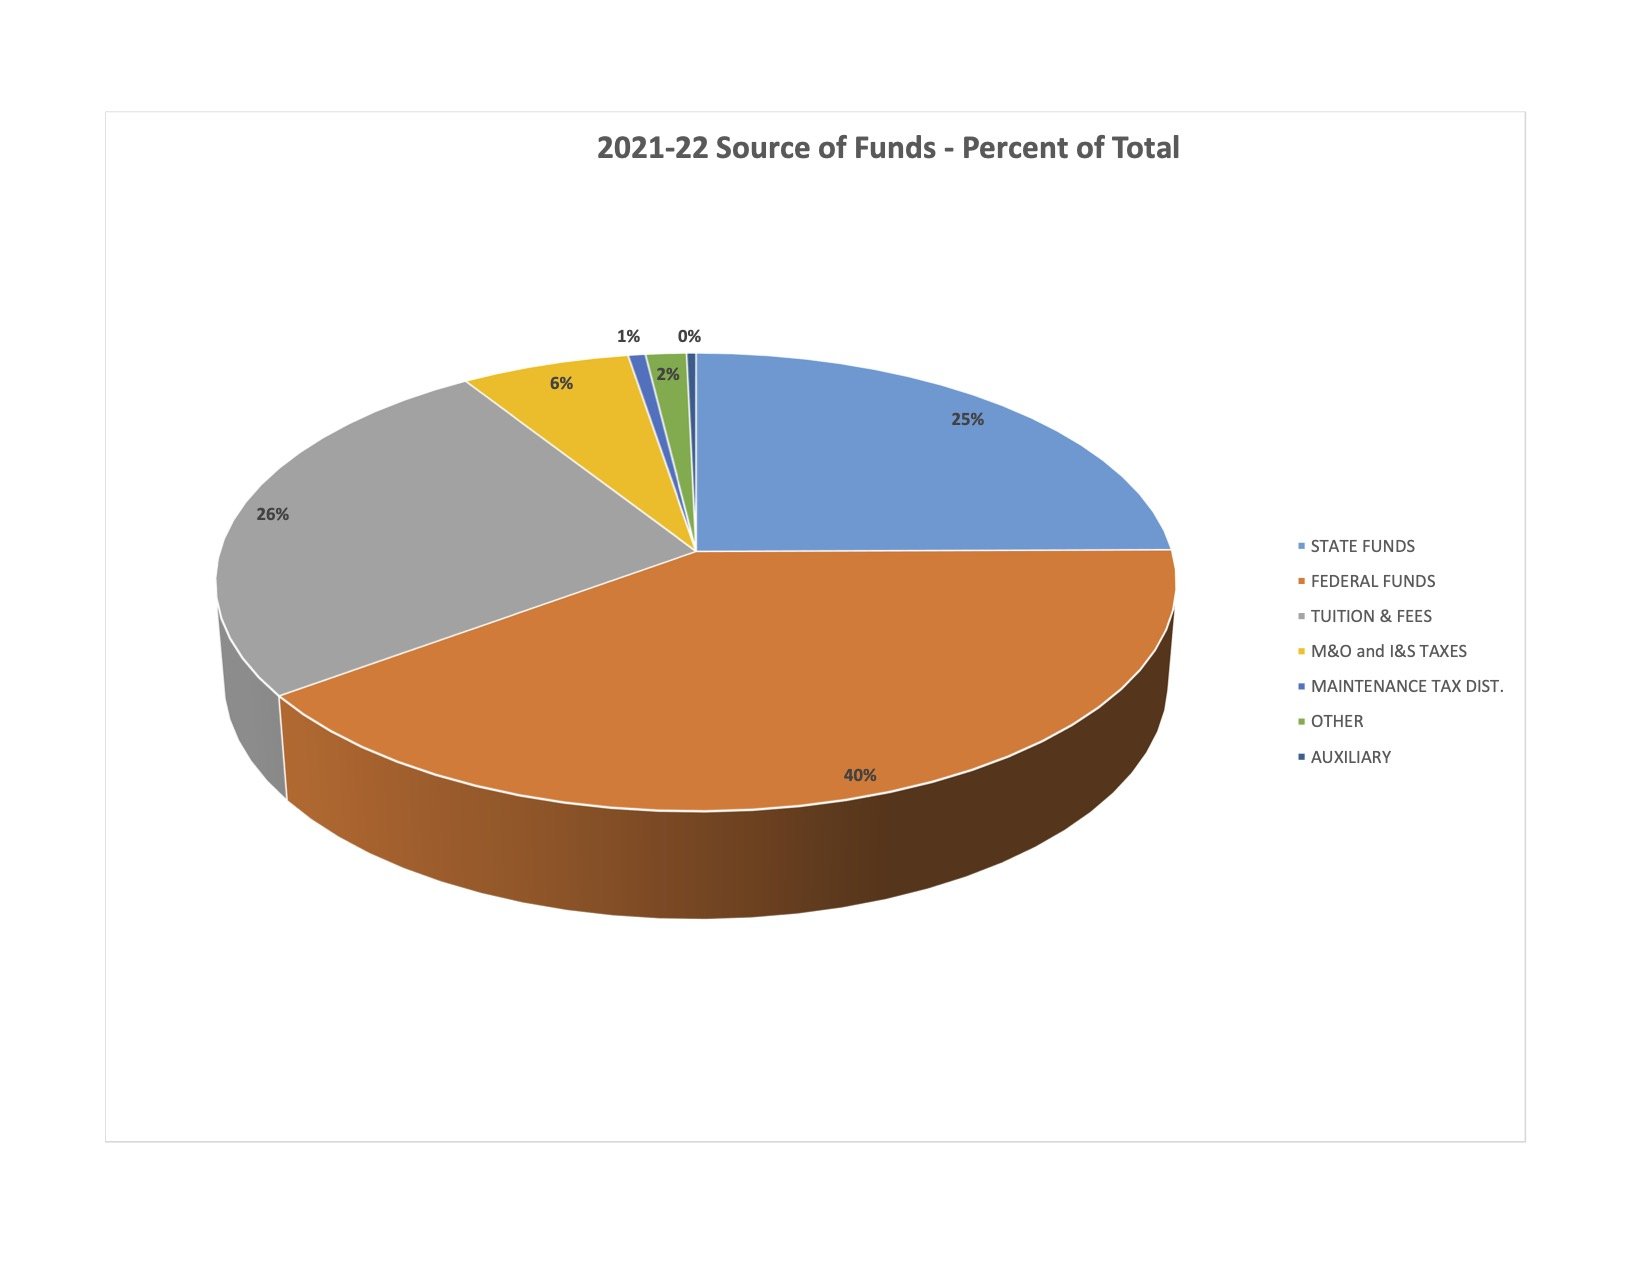
State Funds
2020-2021 — $17,232,611
2021-2022 — $17,327,435
Difference — $94,824
2020-2021 % of Total — 23.00%
2021-2022 % of Total — 24.88%
% Increase or Decrease — 0.55%
Federal Funds
2020-2021 — $23,992,240
2021-2022 — $27,885,353
Difference — $3,893,113
2020-2021 % of Total — 32.02%
2021-2022 % of Total - 40.04%
% Increase or Decrease — 16.23%
Tuition & Fees
2020-2021 — $20,844,482
2021-2022 — $18,119,617
Difference — $(2,724,865)
2020-2021 % of Total — 27.82%
2021-2022 % of Total — 26.02%
% Increase or Decrease — (13.07%)
M&O, I &S Taxes
2020-2021 — $4,211,464
2021-2022 — $4,500,945
Difference — $289,481
2020-2021 % of Total — 5.62%
2021-2022 % of Total — 6.46%
% Increase or Decrease — 6.87%
Maintenance Tax District
2020-2021 — $427,475
2021-2022 — $461,330
Difference — $33,855
2020-2021 % of Total — 0.57%
2021-2022 % of Total — 0.66%
% Increase or Decrease — 7.92%
Other
2020-2021 — $8,019,208
2021-2022 — $1,094,535
Difference — $(6,924,673)
2020-2021 % of Total — 10.70%
2021-2022 % of Total — 1.57%
% Increase or Decrease — (86.35%)
Auxiliary
2020-2021 — $194,681
2021-2022 — $251,436
Difference — $(56,755)
2020-2021 % of Total — 0.26%
2021-2022 % of Total — 0.36%
% Increase or Decrease — 29.15%
Grand Total
2020-2021 — $74,922,161
2021-2022 — $69,640,651
Difference — $(5,281,510)
2020-2021 % of Total — 100%
2021-2022 % of Total — 100%
% Increase or Decrease — 7.05%
Comparison of Use of Funds 2020-2021 to 2021-2022 (in dollars)
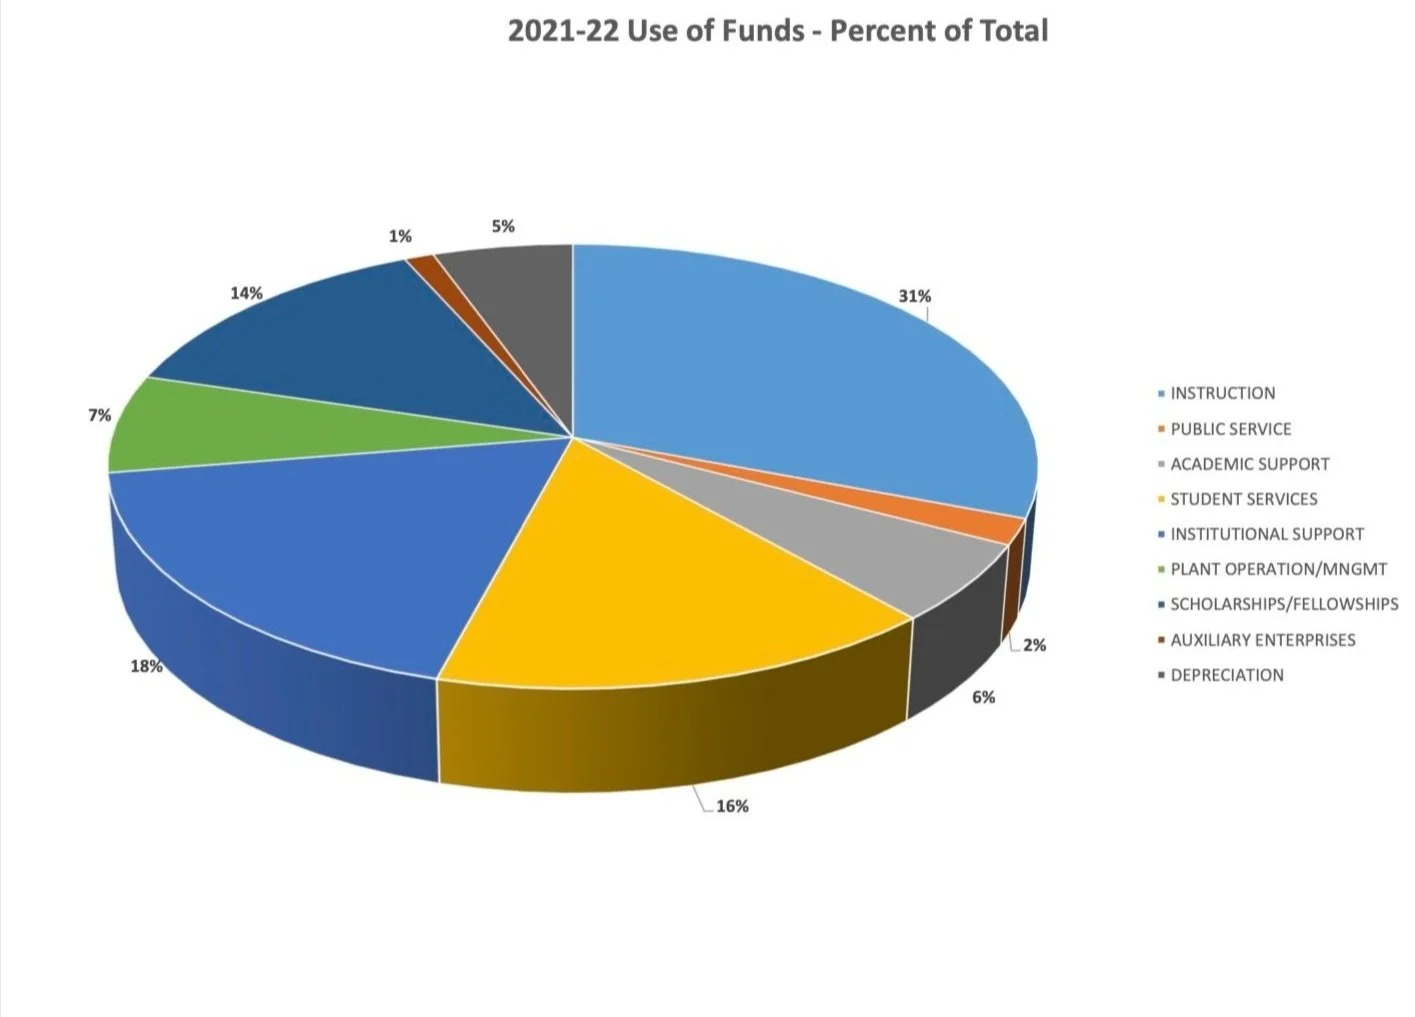
Instruction
2020-2021 — $21,045,398
2021-2022 — $21,096,877
Difference — $(51,479)
2020-2021 % of Total — 33.89%
2021-2022 % of Total — 30.78%
% Increase or Decrease — (0.24%)
Public Service
2020-2021 — $1,442,750
2021-2022 — $1,296,164
Difference — $(146,586)
2020-2021 % of Total — 2.32%
2021-2022 % of Total — 1.89%
% Increase or Decrease — (10.16%)
Academic Support
2020-2021 — $4,058,940
2021-2022 — $3,946,512
Difference — $(112,428)
2020-2021 % of Total — 6.54%
2021-2022 % of Total — 5.76%
% Increase or Decrease — (2.77%)
Student Services
2020-2021 — $9,609,840
2021-2022 — $10,779,742
Difference — (1,169,902)
2020-2021 % of Total — 15.47%
2021-2022 % of Total — 15.73%
% Increase or Decrease — (12.17%)
Institutional Support
2020-2021 — $10,750,005
2021-2022 — $12,546,377
Difference — $1,796,372
2020-2021 % of Total — 17.31%
2021-2022 % of Total — 18.31%
% Increase or Decrease — 16.71%
Plant Operation/ Management
2020-2021 — $4,950,995
2021-2022 — $4,909,394
Difference — $(41,601)
2020-2021 % of Total — 7.97%
2021-2022 % of Total — 7.16%
% Increase or Decrease — (0.84%)
Scholarships/ Fellowships
2020-2021 — $7,281,257
2021-2022 — $9,379,133
Difference — $2,097,876
2020-2021 % of Total — 11.73%
2021-2022 % of Total — 13.68%
% Increase or Decrease — 28.81%
Auxiliary Enterprises
2020-2021 — $548,969
2021-2022 — $794,221
Difference — $245,252
2020-2021 % of Total — 0.88%
2021-2022 % of Total — 1.16%
% Increase or Decrease — 44.68%
Depreciation
2020-2021 — $2,411,199
2021-2022 — $3,789,841
Difference — $1,378,642
2020-2021 % of Total — 3.88%
2021-2022 % of Total — 5.53%
% Increase or Decrease — 57.18%
Grand Total
2020-2021 — $62,099,353
2021-2022 — $68,538,261
Difference — $6,438,908
2020-2021 % of Total — 100%
2021-2022 % of Total — 100%
% Increase or Decrease — 10.37%
Downloadable Annual Budgets
Budget 2023-2024.
Budget 2021-2022.
Budget 2020-2021.
Budget 2019-2020.
Budget 2018-2019.
Budget 2017-2018.
Budget 2022-2023.
Contact us.
NCTC Financial Services
1525 W. California Street
Gainesville, TX 76240
(940) 668-7731
Fax: (940) 668-3320
Contact Information for NCTC Board of Regents
Karla Metzler, Chair
kmetzler@nctc.edu
Christy Morris, Vice-Chair
cmorris@nctc.edu
Dillon Ott, Secretary
dott@nctc.edu
Jon Grime
jgrime@nctc.edu
Jerry Henderson
jdonhenderson@nctc.edu
Erica Sullivan
esullivan@nctc.edu
Lisa Bellows
lbellows@nctc.edu